Binance Cat (BNBCAT) Fell 21.2% While the Same Liquidity Turns Over 49.4x in a Day
Volatility Event
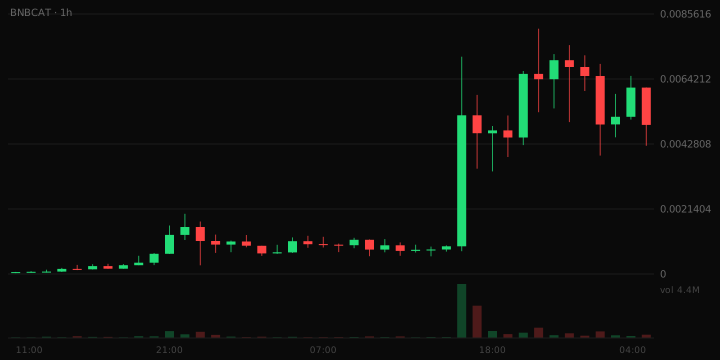
During the last hour, Binance Cat (BNBCAT) traded between $0.004883 and a lower limit that reflects the recent drop, with a turnover of $281,935. This indicates a significant price movement in a relatively orderly manner, although the extent of the drop suggests heightened trading activity.
- Volume vs liquidity: 49.4x
- Pair maturity: 1.7 days
What The Risk Data Shows
The strongest contributor is volume vs liquidity: 24h volume is 49.4x the pool's liquidity. The same liquidity is being turned over repeatedly, which can indicate wash trading or bot activity. The overall risk band is classified as Elevated.
Trading Conditions
In the last hour, there were 809 buys and 463 sells, indicating a buy-side leaning with 36% of transactions being sells. This balance suggests that while selling pressure exists, buying activity remains robust.
Liquidity Context
The liquidity figure stands at $247,482, which is adequate for ordinary position sizes, though not deep. This level of liquidity implies that while trades can be executed, larger orders may face slippage.
Why This Was Flagged
- Price moved 21.2% in one hour (threshold: 15%)
- One-hour volume of $281,935 (threshold: $25,000)
- 1,272 trades in the last hour (threshold: 100)
- $247,482 of liquidity (threshold: $50,000)
- $4,883,954 market cap (threshold: $250,000)
- Trading pair 41.6 hours old (threshold: 15 minutes)
Risk Note
This article is not financial advice.