Binance Cat (BNBCAT) Fell 24.1% While the Same Liquidity Turns Over 29.4x in a Day
Volatility Event
During the last hour, Binance Cat (BNBCAT) traded between $0.0008576 and $0.0006463, with a turnover of approximately $93,716. The price movement indicates a significant volatility event, as the asset experienced a drop of 24.1% within this timeframe, reflecting a rapid shift in market sentiment.
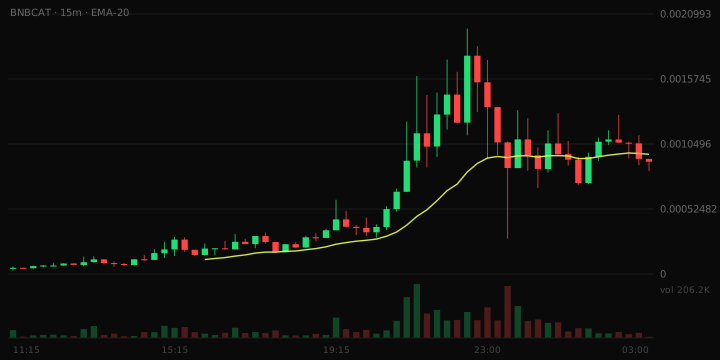
- Volume vs liquidity: 29.4x
- Pair maturity: 15.7 hours
- Liquidity depth: $93,716
What The Risk Data Shows
24h volume is 29.4x the pool's liquidity. The same liquidity is being turned over repeatedly, which can indicate wash trading or bot activity. The overall risk band is Moderate.
Trading Conditions
In the past hour, there were 562 buy transactions compared to 369 sell transactions, indicating a buy-side leaning in the order flow. This imbalance may suggest a temporary interest in acquiring the asset despite the recent price drop.
Liquidity Context
The liquidity figure stands at $93,716, which implies that while it is workable for small positions, larger orders may move the price against traders. The liquidity depth is a critical factor in assessing the potential impact of significant trades on the market.
Why This Was Flagged
- Price moved 24.1% in one hour (threshold: 15%)
- One-hour volume of $77,151 (threshold: $25,000)
- 931 trades in the last hour (threshold: 100)
- $93,716 of liquidity (threshold: $50,000)
- $857,686 market cap (threshold: $250,000)
- Trading pair 15.7 hours old (threshold: 15 minutes)
Risk Note
This article does not constitute financial advice.