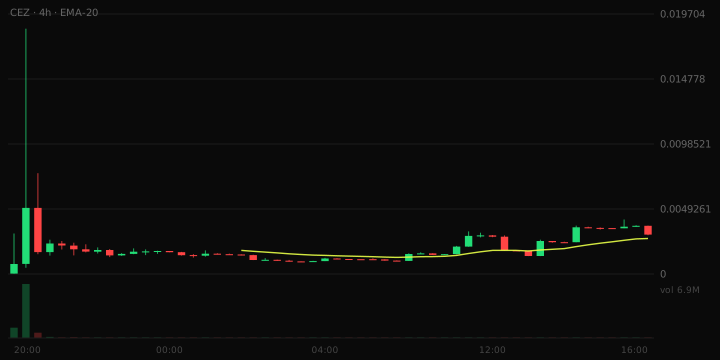
Collective Evidence of Zero-Days (CEZ) Slides 17.5%, With No Elevated Risk Indicators Detected
Volatility Event
During the last hour, the price of Collective Evidence of Zero-Days (CEZ) fluctuated between $0.002991 and a low of $0.002473, with a total turnover of approximately $169,988. This indicates a relatively orderly move given the volume and liquidity present in the market.
What The Risk Data Shows
The strongest contributor is liquidity depth: $169,988 of liquidity. Adequate for ordinary position sizes, though not deep. Liquidity is 5.7% of market cap, close to the 4.6% typical at this size. The pair is 9 days old, with an established trading history. The overall risk band is Low.
Trading Conditions
In the last hour, there were 76 buys and 24 sells, indicating a buy-side leaning in the order flow. This balance suggests that market participants are more inclined to purchase CEZ at the current price levels.
Liquidity Context
The liquidity figure stands at $169,988, which implies adequate depth for ordinary position sizes. However, it is not deep enough to absorb large trades without impacting the price significantly.
Why This Was Flagged
- Price moved 17.5% in one hour (threshold: 15%)
- One-hour volume of $25,928 (threshold: $25,000)
- 100 trades in the last hour (threshold: 100)
- $169,988 of liquidity (threshold: $50,000)
- $2,985,970 market cap (threshold: $250,000)
- Trading pair 9 days old (threshold: 15 minutes)
Risk Note
This article does not constitute financial advice.