Collective Evidence of Zero-Days (CEZ) Gains 329.0% as Volume Runs 50.6x Its Liquidity, a Pattern Consistent With Wash Trading
Participation Event
In the last hour, there were 29,441 transactions involving Collective Evidence of Zero-Days (CEZ), with a notable increase compared to previous trading periods. The trading activity consisted of 16,296 buys and 13,145 sells, indicating a robust interest in the token during this time frame.
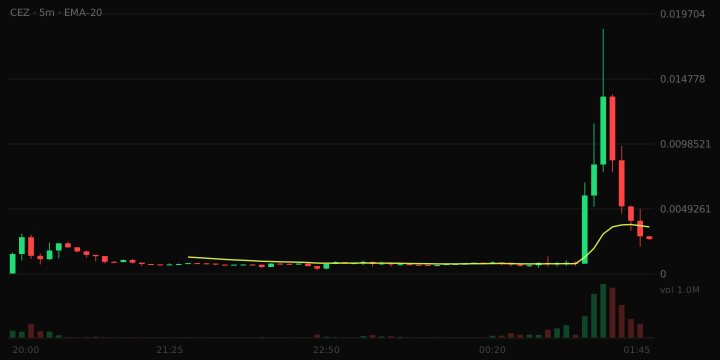
- Volume vs liquidity: 50.6x
- Pair maturity: 5.7 hours
Transaction Breakdown
The transaction count included 16,296 buy orders and 13,145 sell orders. This distribution reflects a balanced order flow, with buys slightly outpacing sells.
Market Activity
The 24-hour trading volume for CEZ reached approximately $7,092,581, significantly exceeding the liquidity of $140,058. This volume is 50.6 times the liquidity, suggesting a high frequency of trading activity.
Liquidity Profile
The liquidity for CEZ stands at $140,058. This level is adequate for ordinary position sizes, although it is not deep relative to the trading volume observed.
Risk Note
Investors should consider that this report does not constitute financial advice. The elevated risk associated with CEZ is highlighted by the significant volume compared to liquidity, which may indicate potential wash trading or bot activity.