NVDA RTX STOCKS (RTX) Drops 18.8% Against $101,077 of Depth, Leaving Little Room to Exit at the Quoted Price
Volatility Event
The trading range for NVDA RTX STOCKS (RTX) during the last hour was between $0.0005036 and a lower price point, with 280 transactions recorded. The total turnover was approximately $45,986, indicating that while there was significant activity, the liquidity depth of $101,077 suggests limited capacity for larger trades without impacting the price.
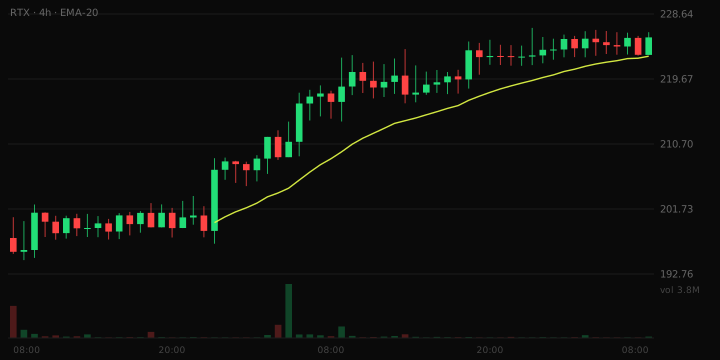
- Liquidity depth: $101,077
What The Risk Data Shows
The strongest contributor is liquidity depth: $101,077 of liquidity. Workable for small positions, but larger orders will move the price against you. Liquidity is 20.1% of market cap, close to the 13.4% typical at this size. The pair is 10 days old, with an established trading history. The overall risk band is Moderate.
Trading Conditions
In the last hour, there were 171 buys and 109 sells, indicating a buy-side leaning with 61.1% of transactions being purchases. This balance suggests a slight preference among traders to acquire the asset despite the price drop.
Liquidity Context
The raw liquidity figure stands at $101,077, which implies that the market can support small trades but may struggle with larger orders. This liquidity level is critical in understanding the potential impact of significant buy or sell orders on the price.
Why This Was Flagged
- Price moved 18.8% in one hour (threshold: 15%)
- One-hour volume of $45,986 (threshold: $25,000)
- 280 trades in the last hour (threshold: 100)
- $101,077 of liquidity (threshold: $50,000)
- $503,618 market cap (threshold: $250,000)
- Trading pair 10 days old (threshold: 15 minutes)
Risk Note
This article is for informational purposes only and does not constitute financial advice.