MarsCoin (MARSCOIN) Risk Assessment on Bsc
Risk Overview
MarsCoin currently exhibits a moderate risk level, primarily due to its liquidity relative to market capitalization. With liquidity at 1.7% of its market cap, the token is positioned close to typical levels for its size.
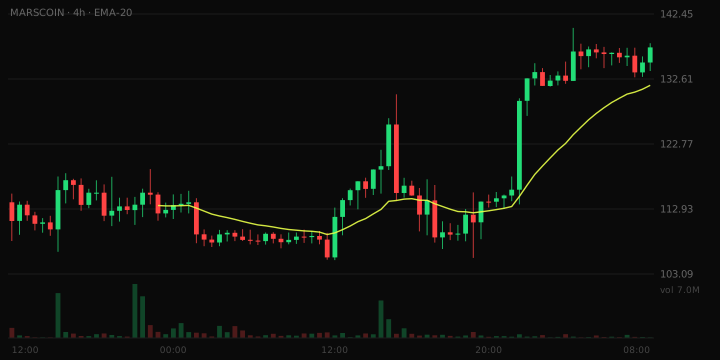
TA · Uptrend — price above EMA-20 and EMA-50 · RSI 69 (firm) · near the top of its range · 24h +0% on $1.1M vol · 24h flow 60% buy / 40% sell · liquidity $1M · pool 14d old
Scalper risk score
24/100
Low
Low risk (24/100). The strongest contributor is liquidity vs market cap: Liquidity is 1.7% of market cap, close to the 1.7% typical at this size. Assessed on 7 of 8 components; liquidity lock unavailable.
Full risk assessment and coverage for MARSCOIN →
Liquidity Assessment
The raw liquidity figure for MarsCoin stands at $1,031,735. Liquidity is 1.7% of market cap, close to the 1.7% typical at this size.
Volume Assessment
The 24-hour trading volume for MarsCoin is reported at $1,111,609. 24h volume is 1.1x liquidity, a normal turnover rate.
Trading Behaviour
In the last hour, there were 166 buy transactions and 61 sell transactions, resulting in a buy/sell ratio of approximately 2.72:1. Transaction-level buy/sell data was not available.
Risk Note
This analysis does not constitute financial advice.